No products in the cart.
Uncategorized
Graphical user interface of PIWIS TESTER 2
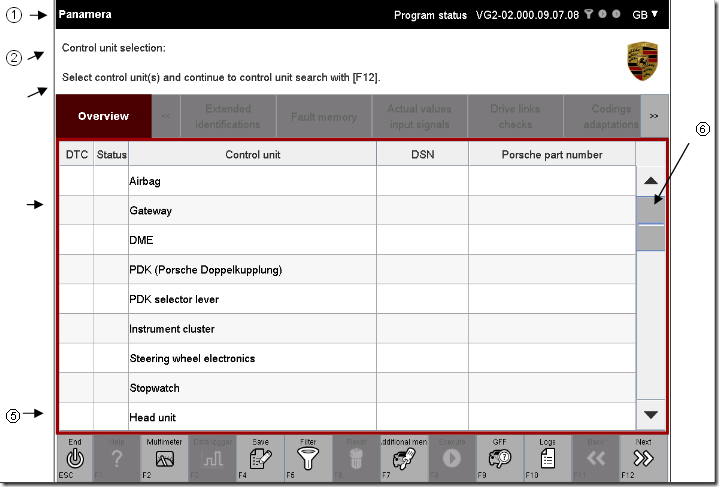
The diagnostic application has a graphical user interface. The elements of this interface are shown as follow.
The function or meaning of each element on this interface:
① Title bar:display the status of Filter active / inactive, Background processing (data logger) active/inactive and Simulation started/stopped/recording.
②Info area: Tips and information on using the elements shown in the screen are provided in the Info area.The content of the Info area depends on the current status of the diagnostic application. In addition to information, this area is also used to display warnings about possible incorrect system operation.
③menu bar: The available function groups of the current diagnostic application are displayed in the menu bar.
④working area:The content of the individual display screens is shown in the working area.The content is displayed either in text form or as a symbol. The content shown depends on the selected action and the current status of the diagnostic application.
⑤control bar: The actions that can be performed on the basis of the operating options available in the current context are shown there.The possible actions are displayed as icons and are based on the current status of the diagnostic application. Some of the possible actions are available for all screens.
⑥scroll bar: Using the scroll bar, you can move up and down the screen if the data to be displayed exceeds the available display area.

